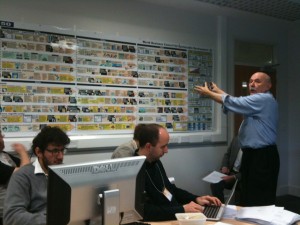
Visual Analytics 2010 summer school
With great backup from my colleagues Anna De Liddo and Michelle Bachler, I spent last Thurs/Fri at the first UK Visual Analytics Summer School (VASS 2010), hosted at Middlesex University. Huge thanks to Simon Attfield for pulling together this week-long event. (3 Jan 2011: all the lecture videos are now replayable).
In my tutorial, as well as drawing on the foundational work of my long-term collaborators Jeff Conklin (gIBIS; Dialogue Mapping), Maarten Sierhuis and Al Selvin (Conversational Modelling; Knowledge Art), I drew on the pioneering work of Bob Horn and Tim van Gelder: Bob Horn from Stanford, developer of the Turing Test Great Debate Maps, was actually able to join the event on Friday thanks to fortuitous travel to UK, and it was great to see him present some of the latest work he has been doing with his large scale information murals visually synthesising outcomes of the World Business Council for Sustainable Development backcast analysis to a sustainable 2050 as a Pathway Mural:

 Bob Horn’s Pathway Mural for the WBCSD
I also drew in my talk on the work of Tim van Gelder, who has done foundational work in articulating the discipline of Argument Mapping for real world visual deliberation:
Here’s the video of my lecture…
…and the slides [download PDF]
We then ran a hands-on session with Compendium, and gave an extended demo of Cohere, below [zipped hands-on exercises] – view the video replays:
The key message I took away was that the work that we are focusing on — visual analytics for scaffolding interpretations/debate about what a given element means — was recognised as distinctive and filling a potentially valuable niche, and we need to take the conversations further to connect this layer of meaning-making (in which the sensemaking is largely dependent on human insight making connections), with the many other powerful visual analytics tools that help automatically detect patterns in datasets and documents.
The “craft skill” of using computational tools for thinking/modelling is a long-term interest of mine. Tools for higher level thinking can rarely be “thrown over the wall” and put to immediate use by newcomers. As my colleague Al Selvin emphasises in his research on Knowledge Art, these are better thought of as musical instruments: they can enable virtuoso performances, but don’t expect this on Day 1. So, I found agreement that the third dimension in our framework requires more attention: understanding the nature of fluency with these tools, which includes the habits of mind and skillset required to use them well. Who are we designing these tools for, and how much does a given person need to know in order to gain value, and how soon?
Links to the following talks will take you deeper into some of the areas that I covered in the lecture, including the Online Deliberation Emerging Technologies workshop (demos of lots of tools in this part of the visual analytics space), and these recent talks provide many other examples of Compendium in use, and sensemaking frameworks: On Social Learning, Sensemaking Capacity, and Collective Intelligence and Software Agents in Support of Human Argument Mapping
Further reading:
- An example of using Compendium to create a multi-dimensional information and deliberation space (blog post):
De Liddo, Anna and Buckingham Shum, Simon (2010). Capturing and representing deliberation in participatory planning practices. In: Fourth International Conference on Online Deliberation (OD2010), 30 Jun – 2 Jul 2010, Leeds, UK. - Rationale for the idea of “contested colletive intelligence” and Cohere:
De Liddo, Anna and Buckingham Shum, Simon (2010). Cohere: A prototype for contested collective intelligence. In: ACM Computer Supported Cooperative Work (CSCW 2010) – Workshop: Collective Intelligence In Organizations – Toward a Research Agenda, February 6-10, 2010, Savannah, Georgia, USA. - Finding a language to talk about fluency:
Selvin, A.; Buckingham Shum, S. and Aakhus, M. (2010). The practice level in participatory design rationale: studying practitioner moves and choices. Human Technology: An Interdisciplinary Journal of Humans in ICT Environments, (Special Issue on Creativity and Rationale, Ed. John Carroll), 6, (1), pp.71–105.

Mar 3rd, 2011 at 2:34 am
[…] Visual Analytics Summer School 2010 Learning Power: […]