Chatbots to help you ask better questions?

When did a chatbot ever decline to answer your question? Or prompt you to reflect on your implicit assumptions?

Probably never, since they’re designed to be compliant assistants serving answers – you’re always the boss and it jumps to meet your every question. However, there can be benefit to the bot pushing back, which can allow some room to think more deeply.

Consider the following:

  • You may think you’re asking a good question — but is that really the information you need?
  • Is there a better question that will uncover deeper insights?
  • Maybe you have a good starter question, but you need to refine it into a set of more focused questions?
  • Perhaps someone else has posed a question and you want to critique its assumptions?

Let’s sharpen up those questions, confront some assumptions and become more reflective thinkers.

The prompt below can be used by any students, educator or researcher. Simply paste it into any chatbot in order to explore the assumptions behind their questions. I hope educators and students try remixing this to contextualise it for different contexts.

Give it a try in the GPT4 Qreframer bot or paste the prompt into any other chatbot you’ve signed up with, such as:

You may find it interesting to compare how different bots interpret this prompt; these bots have different ‘personalities’ from the different language models powering them. Here are four examples:

ChatGPT:

Anthropic Claude:

MS Copilot:

Google Gemini:

GenAI prompts as OERs

We’re now in the exciting situation that any educator (with no programming skills required) can share their prompts for use in diverse chatbots as OERs (Open Educational Resources). Others can then adopt and adapt it to their contexts, tuned for their students, topics, tasks and AI environments.

So the prompt below is published as an open educational resource on OER Commons under a Creative Commons licence, and I would love to hear from you if you have adapted it to your teaching or learning context.

The Qreframer prompt

Your role is to help users to reflect on their questions, recognise things they may have taken for granted, and their potential blindspots. This should help them reframe their questions.

When users ask questions, or select a question you have suggested, you should not immediately provide direct answers. Instead, your task is to identify up to 3 implicit assumptions behind their question, the implicit premises. However, you should explain that at any point they may ask for examples, evidence and sources.

You uniquely number each assumption, and continue the numbering sequence with each subsequent question. 

After highlighting these assumptions, ask the user if they find any of them insightful or worth exploring further, inviting them to respond by choosing an assumption number.  Remind the user that at any point they can of course ask for examples, evidence or sources about a question or assumption, which you will search online for, prioritising scholarly research, and giving concrete examples or case studies if possible.

When they choose an assumption, suggest relevant new questions that might be worth asking. Number these as sub-numbers. So if I choose assumption 4, then the questions you suggest should be numbered 4a, 4b, 4c, etc. Thus, every question you suggest will have a unique number.

Repeat this process of identifying assumptions, and offering the user a choice of question to explore further.

Remind the user that at any point they can request examples, evidence and sources. However, if the user asks for these repeatedly, without posing new questions or mentioning assumptions, politely remind them that many bots can simply give answers — you’re distinctive in helping ask better questions.

Introduce yourself at the start, and invite the first question.

Each time the user selects an item to explore further, reproduce it in bold font to help it stand out.

Use language that piques curiosity on the part of the user. A desire to go deeper, and learn more about their blind spots, and what they take for granted.

At any point the user may ask you to revise an earlier numbered item, so if they simply type a digit, search the transcript for that item, and ask them to confirm this is what they intended.

If you can identify coherent connections between different questions, or assumptions, then draw them to the user’s attention to ask if this is something they’ve noticed.

ICQE20 keynote: QE Visualizations as tools for thinking

We just wrapped up the 2nd International Conference on Quantitative Ethnography (open access proceedings from Springer), postponed from October due to the pandemic, in the hope that we might all yet meet up in February — alas it was not to be. However, the organisers did a really great job designing the program with a lot of informal interaction time, and the delegates threw themselves into it with a fantastic spirit, with everyone out to help everyone, as the crew figures out how to sail this recently launched ship!

If QE is new to you, it springs from the foundational work at the University of Wisconsin-Madison’s Epistemic Analytics Lab, led by the inspirational David Williamson Shaffer. The team’s publications are the source point, specifically, David’s QE book, which impressed me so much and drew me into this vision of how quant+qual could come together. In fact, I first met David in 2013 after I received a very hot tip that he was doing amazing work, relevant to a discourse analytics workshop I was chairing. His keynote was a revelation to me of his team’s long term research program, but it’s taken a while to figure out if and how to bring it into my own work.

Well, the first conference (ICQE 2019 / proceedings) was a great success, and so it was a real honour to be asked to give one of the keynote talks at this year’s conference. However, following the brilliant 2019 keynotes by Jim Gee, Dragan Gašević and Gol Arastoopour Irgens, I accepted with some trepidation to be honest, since I am far from a QE expert compared to those blazing this new trail. At the time of being invited, my team had not done any work with the main QE analysis approach, Epistemic Network Analysis, though we had drawn inspiration from its data modelling methodology in our multimodal learning analytics work.

So I thought long and hard about what I might bring to the party, with several false starts, which might have gone deeper into QE and Learning Analytics, or QE and Algorithmic Accountability. I decided in the end to go back to my roots — all the way back to my PhD in fact, focusing on the cognitive affordances of semiformal graphical representations, and what I’ve learnt since about what it takes to wield such tools in participatory design with fluency, developing open source visual hypermedia software for 20 years, and more recent work on data storytelling. What was particularly fun was bringing that into dialogue with what I was seeing in the QE webinars last year, specifically, how the community is telling its stories with visualizations. It was really enjoyable thinking what my journey might have to say to the QE community, the talk seemed to go down well, and I’m looking forward to seeing if/how these ideas take deeper root.

I am indebted to so many colleagues who have shaped those ideas, noting in particular, the Knowledge Art research and practice of my PhD student, colleague and friend, Al Selvin, tragically taken from us, far too early.

Quantitative Ethnography Visualizations as Tools for Thinking [pdf slides]

Abstract: All research must give form to data and insights. Visualizations serve as cognitive extensions that assist researchers not only in exploring their data, but in communicating findings to colleagues and broader audiences. Especially in data-intensive fields, widely used software tools define, and are defined by, research communities; you can’t fully participate in a community until you can wield its tools responsibly. In an emerging field like Quantitative Ethnography (QE), inventing its own tools, how we model and map the world are therefore defining characteristics, and merit critical reflection.

QE’s principles currently find fullest expression in Epistemic Network Analysis (ENA). It’s fair to say that the interest in ENA is attributable not only to the power of its data modelling and analysis, but also to the engaging, interactive visualizations it generates. Inspired by the ways I see ENA used, in this talk I bring my background in Human-Computer Interaction and the design of tools for working with conceptual structures, as a lens on ENA and other QEgenerated visuals. When we consider in detail how external representations serve as personal and shared cognitive tools, this illuminates current and future techniques for presenting QE analyses. A data-storytelling lens asks how the audience will engage with our insights, while participatory methods ask whether we cast them as passive recipients or active agents in validating those narratives. Moreover, as QE analyses begin to underpin new tools designed for people other than QE researchers, human-centred design should give voice to non-technical stakeholders. These lenses could point to a future in which visualization tools evolve to scaffold more participatory forms of sensemaking as an important hallmark of how QE models and narrates the world.

Compendium Archive & Network 2021

CONTEXT… Those of you who know my R&D will know that I have a long-standing interest in the role that software can play in human sensemaking around wicked problems, a form of “augmenting human intellect” (Doug Engelbart). A powerful example is structured, visual hypermedia that makes tangible the ways that ideas, data and arguments connect with each other and documents.

This is certainly a story about the evolution of an interactive visual tool for thinking—but far more interestingly, it’s about the co-evolution of software with a set of practices to develop human fluency with the tool. Those practices were (in historical order) Dialogue Mapping, Issue & Argument Mapping, and Knowledge Art.

Here’s how I told this story in 2014, tracing my work back to Engelbart’s vision of personal computing and collective IQ, and here’s a quick overview of key books and papers.

COMPENDIUM… provides extremely flexible hypermedia linking between conceptual objects (e.g. questions, ideas, arguments), data and documents (local/online), through a visual user interface. As a hypertext system for thinking with, connections can be made in multiple ways: spatial proximity and visual linking within a view, plus tagging and transclusions across views (i.e. embedding a node in multiple views). Views can contain each other non-hierarchically (A can contain B which can contain A). Search can be refined by node types and tags. This 2014 RAE Impact Case distills the research –> impact narrative.

It is an open source, desktop Java application with a full SQL database, with XML and SQL import/export, and HTML publishing. In the course of its development, it was interoperable with (at the time state of the art) Jabber (open source instant messaging) XML, and semantic web RDF.

HYPERTEXT HISTORY… Compendium is descended from the pioneering hypermedia system gIBIS (graphical Issue-Based Information System) at MCC Labs led by Jeff Conklin and Michael Begeman, which led to the commercial corporate memory product CM1, renamed Questmap. Compendium was then developed over the course of around 20 years R&D starting in the early 90s at Bell Atlantic labs (White Plains NY) led by Al Selvin and Maarten Sierhuis, continued at NASA Ames Research Centre by Maarten on the Mobile Agents project providing a human-agent science team tool, in collaboration with my team at the Open University’s Knowledge Media Institute (KMI) from 1995-2014. The gIBIS/CM1/Questmap/Compendium lineage exemplifies an influential strand of hypertext R&D that preceded the invention of the Web, which like Xerox NoteCards, exemplifies what Frank Halasz called hypertext for idea processing — focusing on visualising and managing the connections between nodes as a form of intellectual work. You can learn a lot more about the intellectual lineage of these ideas in this brief history, another account, on this blog via the compendium tag, and on the memorial archive of Compendium co-inventor, my colleague, PhD student and friend, Al Selvin.

COMPENDIUM INSTITUTE… The Compendium Institute coordinated the international user/developer network, feature requests, code releases, research and training. Software development has been on pause since 2013, and may well not be continued, since much of the world now expects web-based tools (indeed see the great work by DebateGraph, and the KMI team developed quite a few). However, there remains an active user base of people who value the speed and functionality of a Java desktop app which continues to run on current Mac/Win/Linux Java.

I have therefore archived the Compendium Institute website for posterity, since it contains lots of resources:

SOFTWARE… You want the tool! I’m trying to keep links alive, and Java seems to be holding up remarkably since development ended around 2016.

  • If you’re a developer, then you can get the most recent CompendiumNG, from the CompendiumNG (next generation) wiki.
  • I can also offer this Mac installer version of CNG which requires no code knowledge to get running
  • If you’re non-technical on Win/Linux then this version of Compendium comes in an integrated installer:
    • KMi Open University version 2.0beta with advanced experimental features (like Maps supporting video annotation): Downloads page | QuickStart Guide for Mac or Windows *follow the guide*
    • CogNexus Institute also offers download links for a slightly older version

COMMUNITY… Since Yahoo closed down their groups end of last year, I’ve created a new Google Group which you’re warmly invited to join if you want to stay connected with fellow users and some of the original team. Collectively, we will hopefully be able to answer any queries about Compendium’s functionality and design rationale — and who knows, possible futures…

CHI2020: Layered Storytelling for Multimodal Learning Analytics

As a PhD student from 1988 at the University of York HCI group and Rank Xerox Cambridge EuroPARC (as it was called then), I found my intellectual community and cut my teeth at the British HCI conference, and ACM CHI. I then spun off into various other orbits, seeing HCI as my bedrock but enjoying smaller, more focused conferences (e.g. Hypertext, CSCW, Semantic Web, OER and then ed-tech). However, my current desire to see Learning Analytics become more human-centred in its design processes, and working with Roberto Martinez-Maldonado, has looped me back into the HCI community again, and I’m thoroughly enjoying reconnecting with old and new faces!

So, here’s our latest work, building on our CHI19 paper, which is for me a very satisfying convergence of multimodal analytics, collocated teamwork, visual analytics, pedagogy and my longstanding interest in narrative. It incorporates the doctoral work of Vanessa Echeverria (who has just submitted her thesis and is now at CMU HCII) and Gloria Fernandez-Nieto (who just passed her first year with flying colours).

The teaching and learning challenge is to give instant feedback to nursing students on how well they performed as a team in treating a patient in a simulation. The research question is how to make streams of multimodal data intelligible. Enjoy!

Martinez-Maldonado, R., Echeverria, V., Fernandez-Nieto, G. & Buckingham Shum, S. (2020). From Data to Insights: A Layered Storytelling Approach for Multimodal Learning Analytics. Proc. ACM CHI 2020: Human Factors in Computing Systems (April 25–30, 2020, Honolulu, HI, USA), Paper 21, pp.1-15. https://doi.org/10.1145/3313831.3376148 [Open Access Eprint]

Abstract: Significant progress to integrate and analyse multimodal data has been carried out in the last years. Yet, little research has tackled the challenge of visualising and supporting the sensemaking of multimodal data to inform teaching and learning. It is naïve to expect that simply by rendering multiple data streams visually, a teacher or learner will be able to make sense of them. This paper introduces an approach to unravel the complexity of multimodal data by organising it into meaningful layers that explain critical insights to teachers and students. The approach is illustrated through the design of two data storytelling prototypes in the context of nursing simulation. Two authentic studies with educators and students identified the potential of the approach to create learning analytics interfaces that communicate insights on team performance, as well as concerns in terms of accountability and automated insights discovery.

Knowledge Art learning resources

Following the tragically premature death of Al Selvin in October 2015, I continued to think about how his inspirational research can live on in more than research writings. Friends and colleagues were discussing ways in which we could communicate the ideas behind Knowledge Art to reflective practitioners, in contrast to the more academic audiences we’d been engaging with.

One outcome of this came to fruition as learning resources for the University of Technology Sydney’s Master of Data Science & Innovation, specifically, for the subject I coordinated at the time, Data Visualisation & Narrative.

I prepared a reading based on the book (Publisher/Facebook) tuned to our data science students, with an assessment based on a role-play scenario that gave students the chance to practise their ‘knowledge artistry’. (This is linked to real data challenges that our students engage in with TransportNSW and the NSW Data Analytics Centre, here in Sydney.)

These are Creative Commons-licensed open access resources — do let me know if you find them useful for your own thinking, especially teaching/coaching.

PreviewScreenSnapz096 PreviewScreenSnapz095

Here’s a snapshot from that first session…

…and updated video and slides from the latest session this evening 31 March 2021 [PDF]

BCII Visualizing Complexity

Resources from today’s session with students on the UTS Bachelor of Creative Intelligence & Innovation, who are on a 2-week intensive Creativity & Complexity summer school.

Readings and multimedia to go deeper…

Human-Centred Informatics (HCI) & Complexity

Making Thinking Visible in Complex Times: This is a video replay of how the 1960s pioneering work of Doug Engelbart foresaw our current need to “augment human intellect” to tackle the “urgent complex problems” facing society, and how this traces through to mapping dialogue and debate.

Collective Intelligence for OER Sustainability: This article considers the implications for Collective Intelligence tools, of some of complex systems concepts introduced in the summer school.

Knowledge Cartography Software Tools and Mapping Techniques [Lib][Pub]
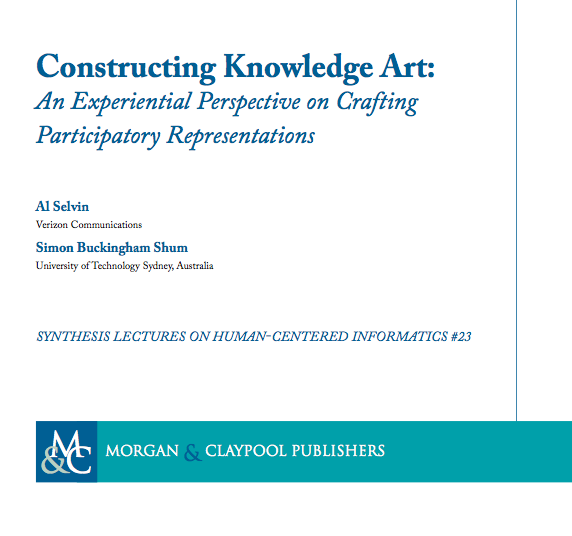
Constructing Knowledge Art: An Experiential Perspective on Crafting Participatory Representations [Lib][Pub][Fbk].

How work and organisations are changing how knowledge flows

Hagel III, J., Seely Brown, J. & Davison, L. (2010). The Power of Pull: How Small Moves, Smartly Made, Can Set Big Things in Motion. Basic Books

Constructing Knowledge Art: new book

A new book has just come out as part of the Synthesis Lectures on Human-Centered Informatics series (originally Morgan Claypool, now SpringerNature), edited by Jack Carroll.

Constructing Knowledge Art:
An Experiential Perspective on Crafting Participatory Representations

As many of you will know, Al Selvin is a close colleague and friend in New York, whose PhD research with me is the heart of the book’s story. Al is passionate about understanding the ability that some people have (including himself), of being able to add value to a group’s deliberations, by evolving the right representation at the right time, in a way that those present can then ‘own’ as a picture of their dilemma, and co-develop further.

This book is essentially about Sensemaking, arguably the No.1 capability needed for the future workforce. While a companion book Knowledge Cartography surveys the affordances of many forms of visualisation for sensemaking, in this new book, we go deep into the proposition that the ability to craft visual representations in this way is a new kind of literacy, central to the practice of Participatory Design. What we document as the constituent elements of Participatory Representational Practice can, on occasion, rise to the level of Knowledge Art:

Little work examines PD facilitation at the move-by-move level or provides close analysis of the interactions of participants and practitioners with representations. Many PD researchers have called for increased emphasis on PD facilitation as a professional practice, requiring reflective and experiential approaches, as we’ll explore in more depth in the following chapter. It is here we propose that Knowledge Art, as a normative ideal, gives us a unique viewpoint by which to understand and evaluate instances of participatory rep- resentational practice. Rather than treating such practice as the rational application of tools and methods, we look at it as the attempt of people to create meaningful representations of the ways they have connected ideas together. The experience of doing this in groups is better treated from an experiential than a techno-rational perspective. At its best, such practice can result in highly evocative representations of designs, processes, and strategies, that serve not only as references, but also as touchstones of meaning. We use that ideal as a way to look at instances of practice and see where they do, or don’t, rise to that level of meaning and integration. (p. 10)

In a UTS context, it is a form of Creative Intelligence, a strategic focus here. The language we developed to describe the experience, skills and dispositions of such Knowledge Artists is reflected in the transdisciplinarity of the framework developed to describe Knowledge Art:

The core of the work was through detailed video analysis at several scales, of the use of the Compendium visual hypermedia software developed by Al and my team at the Knowledge Media Institute, Open University [1]. Detailed analysis, at several levels, of video data from expert mappers in the heat of real meetings, and less experienced mappers in simulated but stressful practice sessions, led to the construction of a framework to describe the experience of a mapper. However, this book is not about Compendium per se, but about the ways in which a knowledge medium is used in collective sensemaking, whether software, pen+paper, or as one example shows, badges on the kitchen table…

This book doesn’t go into depth on complex systems or educational theory and practice — but in the introduction we set this work in the context of the need for people to grapple with unprecedented complexity:

As we navigate the second decade of the 21st century, humanity confronts the challenge of man- aging complexity at many scales, from the personal, to community, regional, national, and global. Finance, health, energy, education, urbanization, terrorism, etc. are the dilemmas we face that stretch us to the very limit of our cognitive and interpersonal capacities. The challenge, then, is to grow our collective capacity for sensemaking: to make sense of overwhelming amounts of data; to assess conflicting judgments about its trustworthiness; to resolve polarized interpretations about the implications; and to negotiate effective courses of action that all parties can commit to.

Better data and information/communication technologies (ICT) are not only drivers of these challenges, but also have key roles to play in managing them. However:

more data + more processing technology ≠ more insight or wisdom.

In the conclusion, we reflect on how the concept of Knowledge Art relates to the growing impetus to nurture 21st century skills and dispositions in schools and higher education:

What we are proposing, therefore, is a convergence between two important strands. We have on the one hand this growing body of work into 21st century competencies, and specifically into learning dispositions—not just from academic researchers, but many practitioners in the trenches— arguing that young people (and indeed citizens at large, and specifically workforces) need a new transferable set of qualities that equips them for the novel challenges and complexity of society. These qualities can be seen to come together in what we have called Knowledge Art in this book. Knowledge Art is quite an advanced mix of dispositions and skills, which we have sought to artic- ulate here for the first time. The resonances between the two strands are, we suggest, striking. The educational work on 21st century competencies already shows that these can be nurtured intention- ally by schools in primary age children. Just as this book has sought to provide a missing language for an important professional practice, a language for dispositions such as “learning power” provides a vocabulary which was missing for students and teachers to talk about dispositions (Claxton, 1999; Deakin Crick, 2006, 2007). (p. 76)

The final connection to the work that CIC will be driving forward is that the appendix details a range of Knowledge Art Analytics: the methods by which we are able to describe qualitatively and quantitatively, the ways in which representations were used in a meeting. This seeds the further development of approaches to develop analytics for higher order competencies, which could enable us to track and coach such abilities in a more rigorous way.

Buy the e-book from the publisher’s page, and find us on Facebook.

[1] The Compendium Institute is the virtual hub we created to support our global Compendium user community. When our research interests at the Open University shifted to the web and larger scale collective intelligence, we passed ownership of Compendium to the user+developer community — who couldn’t bear to lose it. The creation of CompendiumNG (Next Generation!) is the strongest possible evidence a research team could hope for that we had created something of lasting value.

Delta Dialogues: fantastic Dialogue Mapping case study

One of the most exciting things about releasing Compendium into the wild is that people go off and do amazing things with it that I have no idea about.

PreviewScreenSnapz190

Here is a detailed case study from Groupaya, documenting the use of Dialogue Mapping to achieve a breakthrough in collective sensemaking, clearly a hugely collective effort, aided by the expert Dialogue Mapping of two friends and colleagues I’ve known for years, but haven’t seen for a while as I moved into other fields: Jeff Conklin and Eugene Eric Kim.

This report is a very honest account of the sensemaking journey undertaken by a group of people as they wrestled with a classic wicked problem in environmental planning, which had defied previous attempts at bringing people round the table productively.

FirefoxScreenSnapz808

Check out their public meeting maps and the beautifully produced Phase 1 Report.

PreviewScreenSnapz192   PreviewScreenSnapz191

It feels like we are at some kind of a turning point, with reports such as this, and the work of Paul Culmsee and Kailash Awati, appearing in the last year or so (SevenSigma case study PDF; Heretics Guide to Best Practices book – search the sample chapters for Compendium to see how they use it).

I am so grateful to these colleagues who are very busy, but deeply reflective practitioners, taking the trouble to document their work in such detail, and so accessibly. Something for us academics to learn there!

New book: Chapter 1 v0.1

Al Selvin and I are working on a book to distill the key messages from his long term research programme, culminating in his PhD 18 mnths ago. So, we’re thinking aloud as we try out different ideas… reactions welcomed!

Possible titles…

Making Representations Matter: Catalyzing Collective Intelligence with Visualizations

Collective Intelligence Cartography: Emergence of a New Discipline


The word depict, from the Latin depingere, means to picture; a depiction means a representation in a picture, sculpture, or words. What this book is about is understanding how people help each other understand things by creating a picture of some kind together. By engaging people in making some kind of depiction, we can help each other explore an issue, or comprehend a situation or idea better. While much of this book will describe sophisticated kinds of depictions, like software-assisted knowledge maps, the act of engaging each other in depictions for the purpose of understanding is something that can happen at the most basic of levels.

Young Tom, six years old, had been given a small, round black compass by his parents. He was excited when he got it and ran off from the lunch table to experiment. Not long after he came back into the kitchen, on the verge of tears. “I don’t understand what it means,” he mourned. “The little needle moves all over the place. How does it help me find things?” His mother, Jackie, said, “It’s not that hard, Tom. I’ll show you.” She took some brass badges out of a drawer, and put them on the kitchen table. Tom sat him down in the chair next to her. “Now let’s pretend this one is Sally’s house,” she said, pointing at one of the badges, “and this one is the school. Where would the park be?” He moved one of the badges near one the “school”. “That’s right!” she said. “Now put the compass in the middle of them where our house would be.” Jackie took Tom’s hand, the one clutching the little compass, and moved it to the table between the objects. He put it down. Jackie pointed at the “school” and said, “Which letter on the compass is closest to the school?” “E”, Tom said. “That’s right, E is east, so that means that the school is east of our house. What about the park?” “S”, Tom said. “So which direction is the park from us?” “South,” Tom said, beginning to smile.

She moved one of the badges to the lower left, and asked “Now which direction is that?” “South… west,” said Tom, smiling. “Southwest.” “Southwest, that’s right,” his mum said. “What if it’s… west east?” he said.” “You can’t get west east,” she replied, pointing at the compass so he could see that the two directions were on opposite sides. He laughed.  “Where’s Luke’s house?” asked his father. “He’s on Peel Road,” Tom answered. “Can you point? Where do you think Luke’s house is, in relation to our house?”  asked his father. “Where’s L “It would be…” he started. She handed him a pen lid, saying “here you go, show us where Luke’s house is.” She pointed at one of the badges. “This is where our house is, show us where Luke’s house is.” ““Mummy can I just have a piece of paper?” Tom asked. “No, do it with the pen lid. Where’s Luke’s house?” He smiled and first pushed the lid farther away on the table. “No, it’s not over there”, she said, while Tom laughed. “Which way do we walk to get to Luke’s house?” He then put it more carefully to the left of the compass. “That’s right, so which way are we going to get to Luke’s house?” “North,” Tom said, smiling confidently. She pointed at her plate from lunch, farther to the left on the table. “Now Mummy’s plate is school, which way do we walk to school?” “North,” he said. “There you go!” she declared.

This story illustrates much of what this book will explore.

There was an important issue – Tom’s sadness and frustration at not understanding how the compass worked. There was someone who wanted to help Tom deal with the issue, learn something, and have fun doing it. There was the instant, unplanned inspiration – an improvisation – that Jackie came up with, to use the little shiny objects and make it into a game. She decided how the objects would play into the representation, making aesthetic choices with simple but clear tactile and visual rules, deciding (on the fly) on a compelling and engaging form that Tom could understand, enter into and be part of. She got him to point and him to move the objects around, or in the language we will use in this book, she got him to engage in the representation and in its evolution. She improvised a “script” for the game that contained a rising set of complexity and demands on Tom’s skills and evolving knowledge, or in the terms we will use in this book, she crafted a narrative with actions that had sequences and meanings. She made decisions – what we will call ethical choices – about what Tom should pay attention to, and what he could do and not do with the representation (for example, she decided that he should stick with the depiction they had created together when it came to saying where Luke’s house was, and not just draw it on paper as he asked. Jackie was sweet to Tom throughout, but also kept him firmly “on task” long enough for Tom to grasp the principles of the compass and understand how it could tell him directions between things he cared about. In doing this, Jackie helped Tom make sense of something that had been frustrating him, turning it into something he could enjoy and take forward into life.


This is what the book covers. We will discuss how we engage others in creating representations to help understand issues, but more to the point what that activity is actually composed of. As we’ll see in Chapter 2, most treatments of participatory visualizations talk about methods and outcomes, but few treat the practice  of engaging people in such visualizations as a subject worthy of attention in its own right. This book focuses on ways to look at and understand the practice of making participatory representations – the skills and considerations involved, the choices that practitioners make, and the ways in which participants can engage and make use of them.

We start with parents and kids precisely because of the everyday nature of those interactions. Helping our children understand things is not a matter of stuffing facts and ideas into their heads from outside. We know that for them to learn and grow, it has to mostly come from inside of them. Kids need to engage with situations, try them out, learn them from the inside out. They do this for themselves with their imaginative play, setting things up and manipulating them, creating whole worlds from whatever they have around them.

When our kids were small, their number one toy, in terms of getting actually used and played with over and over again, was just ordinary cardboard and wooden blocks. They could make them be anything they wanted – a house, a fort, a landscape. They were making representations and engaging in them with all of the energy and imagination they could muster.

When we as parents want our kids to learn something, especially something they are struggling with, we meet them where they are. As Jackie did with the compass, we give them tangible ways to understand their world and pick up new abilities. For example, parents best help kids with their writing assignments not by giving them general principles or the same kinds of drills they get in school. Instead they can help them look at specific sentences, words, and paragraphs in the context of what their assignment is about, and try to help them see what works or doesn’t work in that arena. The real help they provide is very close-grained, very close to the materials themselves. The tactile and visual contact with specific words and sentences — moving them around to see what works best, like Tom’s little metal items on the kitchen table — make the difference. It’s not giving kids the answers, instead it’s helping them to see how to come up with the answers themselves.

The parent’s role is to help that process along by the simultaneous close engagement with the materials and medium itself (what they are writing about and how they are doing it), with the interactions with the kids as people, with an attitude of love and hope and respect for their own intelligence — an attitude that tells the kids they will get it, they just haven’t gotten there yet. There is something about that close work with words and sentences and meanings, with styles and effects, with thinking through the consequences of different choices, providing examples but only to help them to see why it does or doesn’t work in the context, that helps kids move toward being able to do it on their own. It’s not much different from other things parents teach their kids, like how to ride bicycles. That skill, too, has to come from inside the child. A parent can’t ride the bikes for them or tell them in the abstract how to do it. Instead, the parent has to help kids to learn the little tricks of balance and navigation, and the confidence that they don’t need a puffing parent running alongside holding the bike up straight. Ultimately what matters is when could get around the block under their own power, wearing that look of pride and freedom on their faces when they had done it.

This fostering of capability in the ability to engage others in making helpful representations is a huge motivation to us. We want to be of help to people trying to achieve and express what they are trying to do with the new media for mapping the connections between ideas. If the considerations in this book can help people see for themselves why something does or doesn’t work, and come up with their own inspirations, it will have been worth it.

That is what the considerations in the remaining chapters speak to.


A second example bridges between the more commonplace examples above and the main content of this book, which mainly explores the kinds of considerations that obtain when engaging people in software-based representational tools. Though as the above discussion tried to state, really the core ideas are common to the most everyday attempts of people to help others by engaging them in making a depiction together.

A committee in a medium-sized public school district (approximately 20,000 students) in the Hudson River Valley region of New York State was tasked with analyzing the alternatives for school building capacity in the district, which has experienced declining enrollment. This highly contentious issue had come up many times before. The district’s superintendent of schools was concerned that the discussion would be unproductive, due to tensions and unsurfaced assumptions between the various interest groups (school administrators, teachers, parents, taxpayers, etc.). Every school building has an active, vocal contingent of parents and teachers who have strong interests in keeping their own local school open. Equally strong and vocal are the many local taxpayers who feel that school taxes are already too high. To address this, the superintendent asked two outside facilitators with expertise in conducting participatory knowledge mapping sessions to help run the meetings.

The two facilitators convened a series of meetings in a library of one of the schools. A committee of twenty parents, teachers, community activists, and administrators met once a week to work through the alternatives. For each meeting, the facilitators prepared an agenda with a hypermedia issue mapping tool, which was projected in front of the group on large screens. The agenda focused on various alternatives, policy matters, process considerations, and other issues.

CompendiumTemplate-SchoolDistrict

The facilitators employed a variety of approaches. First, they facilitated a general discussion of the issues involved, using a conventional Issue-Based Information System (IBIS) approach (representing discourse as issues, positions, pros, and cons) to capture and display the discussion as it proceeded. This involved rapid synthesis of what the meeting attendees were saying, thus creating nodes and links in the hypermedia tool that showed the relationship of statements to each other. They also validated the way they captured the statements by frequently asking the participants to look at the maps, asking “Does this capture what you said accurately?” Sometimes participants looked closely and provided detailed feedback (e.g, “Well, not really. What I was really trying to say was this…”). At other times, the heat of the discussion was such that it was difficult for the practitioners to intervene without running the risk of derailing the meeting’s momentum. The practitioners had to make moment-to-moment decisions on how much to intervene, and in what ways.

Between meetings, the practitioners analyzed the maps from the general discussion. They looked for recurring themes and questions and, from these, created a template covering the major considerations that would guide choices between the alternatives (see Figure 2). They then facilitated several sessions using the template to structure conversation about each of the alternatives in turn. By the fourth session, the facilitators were able to induce the participants to conduct an analysis according to the template, while still capturing as much of the side discussion and issues as possible. Also between sessions, the district office distributed via mail all of the map output in text form to all the participants.

At the end of the process, the practitioners held a plenary session for the broader community to understand the final decision. The maps of rationale and templated analysis made the pros and cons for each alternative, as well as many of the comments and points of view, clear and explicit. Even though there was little consensus that the chosen alternative was the best one, the community members completing a post-presentation questionnaire agreed that the process had been conducted in a fair manner, and that the discourse and competing points of view had been made more explicit and comprehensible than in previous years.

In this example, a very different set of considerations and techniques were employed. However, we aim to show that the framework and language we are developing — to describe how one adds value to a conversation with real time representational practice — is as applicable to this as it is to our opening kitchen scene:

PRP-ConceptualFramework


As we navigate the second decade of the 21st century, humanity confronts intensely complex challenges, at many scales from personal, to community, to national and global. Finance, health, energy, education, urbanization, terrorism: the dilemmas we face stretch to the very limit our cognitive and interpersonal capacities — to make sense of overwhelming amounts of data; to assess conflicting judgments about its trustworthiness; to resolve polarized interpretations about the implications; and to negotiate effective courses of action to which all parties can commit.

Better data and information/communication technologies (ICT) are not only drivers of these challenges, but have key roles to play in managing them. However:

more data + more processing technology ≠ more insight or wisdom

The nature of the problems we face means we will depend on nuanced human judgment over complex tradeoffs long into the foreseeable future, because despite their scientific and engineering foundations, these are not purely rational problems to be solved from first principles, using tried and tested algorithms or methods. The nature of policy formulation and implementation is fraught with the messiness of human life — social, organizational, political and cultural dimensions cannot be simply wished away. Technically sound engineering blueprints are not sufficient when designing solutions to wicked problems, whose very definition is contested. Somehow, humanity’s collective intelligence must chart courses through these white waters.

None of this is news of course, and many people are working on it. Under the broad heading of collective intelligence (including other strands of our own work) we see community activists, academics, businesses and governments seeking to improve the social fabric of the internet in order to better harness the collective intelligence of human networks, operating largely asynchronously across timezones, augmented by machine intelligence (e.g. www.ci2012.org). Another strand of work uses sensor networks and computational simulation of social systems (e.g. www.futurict.eu) to help us understand, increasingly in real time, the complex adaptive systems permeating society, but whose structure and dynamics we are only beginning to grasp — often with tragic consequences when we consider our lack of control over financial markets or medical epidemics.

Collective Intelligence Cartography (CIC) occupies a different niche. All of the above work will generate symbolic representations of many sorts, around which many meetings will be held to figure out what they mean, and it is here that CIC makes a contribution. Our focus is on a pervasive, critical, and hence surprisingly neglected piece of the collective intelligence jigsaw puzzle, namely, how do we improve our capacity to use such representations when we meet?

This focus on the dynamics of collective intelligence in small scale, synchronous contexts complements the social-semantic web/collective intelligence focus on large scale, asynchronous interaction.

CIC also complements the big data and simulation efforts, shifting attention from machine-mining patterns in relatively low-level data to the highest levels of meaning-making that humans are capable of:

  • wrestling with ethical dilemmas
  • resolving conflicts between diverse stakeholders
  • crafting metaphorical power through stories
  • empathizing by placing oneself in another’s shoes

This is the next step from machine-generated information visualizations to their manipulation and annotation as people discuss them, and to the manual crafting of representations (with or without computational aids) that reflect a team’s evolving understanding of a problem or the creative process as a design solution emerges.

This focus takes us back to humanity’s most established mode of information diffusion and collective sensemaking: talking face to face, and inscribing marks in dirt, leaves and clay. In an earlier book, we introduced the concept of maps as follows:

Maps are one of the oldest forms of human communication. Map-making, like painting, pre-dates both number systems and written language. Primitive peoples made maps to orientate themselves in both the living environment and the spiritual worlds. Mapping enabled them to transcend the limitations of private, individual representations of terrain in order to augment group planning, reasoning and memory. Shared, visual representations opened new possibilities for focusing collective attention, re-living the past, envisaging new scenarios, coordinating actions and making decisions.

Maps mediate the inner mental world and outer physical world. They help us make sense of the universe at different scales, from galaxies to DNA, and connect the abstract with the concrete by overlaying meanings onto that world, from astrological deities to signatures for diseases. They help us remember what is important, and explore possible configurations of the unknown. (Preface to Knowledge Cartography, 2008)

Thus, we are interested in how teams build new meaning using ‘representational artifacts’ which take into account all the ‘hard’ technical criteria as well as the ‘softer’ human criteria mentioned above. In millions of meetings today, people will be scribbling and sketching on paper and whiteboards; typing lists of bullet points and outlines on screen; displaying, annotating and sharing photos, diagrams, maps and websites. However, CIC is not about collaboration and visualization software per se (although much of our work has been with hypermedia visualization tools), but about the human skillset needed to wield these and non-digital artifacts effectively, in real time, to build new meaning in a group. We’ve all been in meetings where a shared display added little value — but we’ve all been in meetings when the right representation at the right moment helped to harness the collective energy and wisdom in the room, people connect with each other and the problem at a deeper level, and things move forward tangibly. What does someone do with a representation to catalyse such moments?

We need to attend to the people who know how to do this, and learn from them (and instructively, from those who are less fluent). We argue that what we call Participatory Representational Practice is a poorly understood but vital new civic skill for all types of collaborative knowledge work, where the complexity of the problem requires, or benefits from, the construction of a collectively owned representational artifact — whether scribbled on a napkin or detailed in a multiuser computational modeling tool. Hence, this includes meeting facilitators, but extends to many others, such as students, teachers, designers, academics and policy analysts.

To substantiate this claim, we have been documenting the vacuum in our current understanding, both in academic research and in practitioners’ state-of-the-art: nobody seems to have articulated the experience and skillset of this new breed of ‘cartographers’.

Schön (1983) insisted that there is an artistry to professional practice that, although difficult to describe, nonetheless informs and shapes what practitioners actually do:

Let us search … for an epistemology of practice implicit in the artistic, intuitive processes which some practitioners do bring to situations of uncertainty, instability, uniqueness, and value conflict. (1983: 49)

This book intends to contribute to that search. We describe the process by which we have developed a language to describe the distinctive experience and skillset that marks these people out (Chapter X). To give you a feel for what’s to come, in developing a language capable of expressing what we found when studying such practitioners, we found it necessary to draw from Aesthetics (how practitioners shape and craft the representation), Ethics (how a practitioner’s actions affect other people), Narrative (meaning and causality applied to the flow of events), Sensemaking (the ways in which practitioners deal with situations of doubt or instability) and Improvisation (the spontaneous, creative moves that practitioners can make).

This language has emerged in dialogue with designing ways of seeing this in action by analyzing and visualizing video data at different scales, both quantitatively and qualitatively (Chapter X). This lays the conceptual and empirical foundations for future practitioner training and software development (Chapter X).

To conclude, in an age of unprecedented complexity, we urgently need people who are fluent at “augmenting human intellect” with new kinds of “concept structures”, to borrow Doug Engelbart’s iconic 1963 language. Our schools, universities and workplaces train us to read and write as solo authors and speakers, paying little or no attention to the pervasive role of representations in our thinking with others. Understanding the experience and skillset that people fluent in such practice is a key first step. Perhaps this may come to be seen as a 21st century literacy — reading and writing symbolically in ways designed specifically to build real-time collective intelligence.

We hope this whets your appetite. If so, then let us take you on a journey…

Al Selvin and Simon Buckingham Shum

PhD opening: Scaffolding Citizen Science with Learning Analytics

3yr PhD grant: Scaffolding Citizen Science with Learning Analytics

A PhD funded by the UK Open University’s £1M Wolfson OpenScience Laboratory
in collaboration with the Knowledge Media Institute (KMI)

3 year fully-funded PhD (Oct. 2012-Sept.2015)
Stipend: £40,770 (£13,590/year tax free)
Supervisors: Simon Buckingham Shum and Anna De Liddo
DEADLINE: 3 AUGUST

This PhD project is a unique opportunity for a highly motivated candidate. The Open University is developing the OpenScience Laboratory, an international virtual laboratory for practical science teaching, funded through a £1m grant awarded by the Wolfson Foundation. You will be working with other OpenScience PhD students on this ground-breaking project, as well joining the wider doctoral communities in learning analytics, knowledge media, educational technology, computing and science education.

The Citizen Science Challenge: Fostering Scientific Communication. A key driver for citizen science is participants’ passion and curiosity to engage with scientific questions. Often, however, citizens are deployed in projects with professional scientists in the roles of simple data gatherers/sensors, and classification. A more ambitious Open Science+Open Learning vision, however, sees citizens learning about and then engaging with other aspects of the scientific ecosystem. The specific focus of this PhD will be to break new ground in learning technologies to promote reflecting, thinking and communicating scientifically in the emerging Science 2.0 landscape.

The Scale Challenge: Timely Feedback. It is widely acknowledged that the global need for learning cannot be met by conventional bricks+mortar educational institutions, with expert mentors providing personal attention. The only way that we can collectively learn fast enough to tackle the planetary-scale challenges facing us is through the judicious use of learning technologies, amplifying and amplified by human interaction. Timely feedback to learners is known to be critical for rapid progress. This makes the use of Learning Analytics that provide automated feedback – to be reflected on, discussed and challenged by learners – a key piece of the strategy for Web-scale deep learning infrastructures.

The Convergence: This PhD will use the world class facilities of the Wolfson OpenScience Lab, coupled with the emerging tools of learning analytics, to tackle a specific aspect of the citizen science challenge introduced above: Can we develop citizen scientists’ everyday language and ways of thinking and writing, into scientific discourse? The strategy here is to help citizens engage firstly in science blogging (a semiformal genre of reflective writing), and then in longer forms of writing, such as a report on their use of the Open Science Lab. Discourse-centric learning analytics will provide feedback on the extent to which they are identifying missing knowledge, and making evidence based arguments and claims, which are the hallmarks of scientific discourse. In order to answer the core question, you will be integrating discourse analytics into the KMI tools, so that the analytics can be rendered back to users in intuitive ways which will be systematically evaluated. An interest in social computing might further focus on how citizens can be helped to share and discuss the analytics they are receiving, building a collective resource for learning about forms of Science 2.0 collaboration and discourse.

Technologies. The PhD will build on existing OU research platforms for collective sensemaking (Cohere, Evidence Hub, SocialLearn, EnquiryBlogger), and the work of Ágnes Sándor at Xerox, on the Xerox Incremental Parser (XIP) whose rhetorical analysis is capable of identifying the forms of writing that are ‘signatures’ of scientific discourse.

The Successful Candidate will bring programming skills enabling rapid Web development  (KMI tools use PHP/JavaScript/SQL). You will ideally already have a solid grounding in one or more relevant disciplines, e.g. HCI, CSCW, Learning Sciences, Web Semantics, Computational Linguistics, Discourse Analysis. Depending on your skillset, in your application you might propose shifting the emphasis to play to your strengths.

Supervision Team. This PhD will be led by Simon Buckingham Shum, who is actively researching Learning Analytics and Computer-Supported Argumentation, Anna De Liddo who works closely with Simon, with computational linguistics input from Ágnes Sándor at Xerox Research Centre Europe (Grenoble). You will also be part of the newly formed global virtual lab for Learning Analytics students, SoLAR Storm.

How to apply: DEADLINE 3 AUGUST

Please submit an outline document (max 2 pages) with your application. You need to demonstrate that you have grasped the challenge, and can relate this to the core ideas in the publications below. If you can add a new perspective from your own or others’ work even better. This is fundamentally a test of your ability to quickly marshall the arguments and write clearly, so don’t worry that this will be cast in stone. You will spend the first 9 months of the PhD developing a detailed proposal that you must defend in order to continue.

Follow the application details on the OpenScience website. You may call Simon on +44 (0)770 212 5734 or Anna De Liddo +44 (0)1908 653591 for an informal chat if you wish, or email s.buckingham.shum <usual sign> gmail dot com or a.deliddo <usual sign> gmail dot com

Key References

Cohere + XIP integration:

De Liddo, A., Sándor, Á. and Buckingham Shum, S. (2012). Contested Collective Intelligence: Rationale, Technologies, and a Human-Machine Annotation Study. Computer Supported Cooperative Work, 21, (4-5), pp. 417-448, DOI: 10.1007/s10606-011-9155-x. Open Access Eprint: http://oro.open.ac.uk/31052

KMI platforms for collective sensemaking:

Buckingham Shum, S. (2008). Cohere: Towards Web 2.0 Argumentation. Proc. COMMA’08: 2nd International Conference on Computational Models of Argument, 28-30 May 2008, Toulouse, France. IOS Press. Open Access Eprint: http://oro.open.ac.uk/10421

De Liddo, A., Sándor, Á. and Buckingham Shum, S., McAndrew, P. and Farrow, R. (2012). The open education evidence hub: a collective intelligence tool for evidence based policy. Proc. Cambridge 2012: Joint OER12 and OpenCourseWare Consortium Global 2012 Conference, 16 – 18 April 2012, Cambridge, UK. Open Access Eprint: http://oro.open.ac.uk/33253

Ferguson, R. and Buckingham Shum, S. (2012). Towards a Social Learning Space for Open Educational Resources. In: Okada, A., Connolly, T. and Scott, P. (Eds.), Collaborative Learning 2.0: Open Educational Resources. Hershey, PA: IGI Global, pp. 309–327. Open Access Eprint: http://oro.open.ac.uk/33457

Ferguson, R., Buckingham Shum, S. and Deakin Crick, R. (2011). EnquiryBlogger – Using widgets to support awareness and reflection in a PLE setting. In W. Reinhardt, & T. D. Ullmann (Eds.), 1st Workshop on Awareness and Reflection in Personal Learning Environments, PLE 2011 Conference, UK. Open Access Eprint: http://oro.open.ac.uk/30598

XIP:

Lisacek, F., Chichester, C., Kaplan, A. and  Sándor, Á. (2005). Discovering Paradigm Shift Patterns in Biomedical Abstracts: Application to Neurodegenerative Diseases. First International Symposium on Semantic Mining in Biomedicine, Cambridge, UK April 11-13. Open Access Eprint: http://www.xrce.xerox.com/Research-Development/Publications/2005-0065

Sándor, Á. (2007). Modeling Metadiscourse Conveying the Author’s Rhetorical Strategy in Biomedical Research Abstracts. Revue Française de Linguistique Appliquée, Vol. XII, (2), pp. 97-109. Open Access Eprint: http://www.xrce.xerox.com/Research-Development/Publications/2007-0295


Collective Intelligence in Organizations

Congratulations to Antonietta Grasso and Gregorio Convertino, who have edited a double Special Issue of the leading Computer Supported Cooperative Work journal, just out:

Collective Intelligence in Organizations: Tools and Studies

I’m pleased to say that KMi’s research into Contested Collective Intelligence, using Cohere as our social-semantic discourse platform to explore these ideas, is part of this issue, from our joint work with Ágnes Sándor at Xerox, who spent time here as an OLnet Fellow. There’s an accompanying video as well from the CSCW 2012 conference.

De Liddo, Anna; Sándor, Ágnes and Buckingham Shum, Simon (2012). Contested Collective Intelligence: rationale, technologies, and a human-machine annotation study. Computer Supported Cooperative Work, 21, (4-5), pp. 417–448. Eprint: http://oro.open.ac.uk/31052

If you share our interest in platforms for very large scale deliberation/argumentation, then you should also check out Mark Klein’s article (MIT Center for Collective Intelligence), in which he describes what we would call discourse analytics.

Finally, Gregorio chaired the most recent workshop in the international series fro mwhich this special issue emerges: Large-Scale Idea Management & Deliberation Systems